|
Contents:
|
|
|
Contents:
|
|

Readers of my pages will not be surprised to learn that, like so many other people, I am fascinated by vacuum tubes. In contrast to most of these tube-lovers I have, at least up to now, little interest in tube amplifiers. I simply do not have the ears for it! I am however fascinated by the technology of these fragile and romantic devices and I love to read and write about their history. I do however have quite an extensive tube collection, and from time to time I am playing with the idea of making a tube tester, or even better a tester which can measure a set of Ia-Va of Ia-Vg characteristics, in other words a tube curve-tracer.
The reason why I never actually undertook building a tube curve-tracer is the same reason why I dislike most tube circuits: they are always bulky, heavy, and tend to dissipate a lot of energy! Sometimes the most beautiful ideas come at the strangest moments. In this case it was actually when my mind wondered away during the sermon of the Christmas service in our church on Christmas morning 2010. The idea was very simple: instead of measuring the tube characteristics in a continuous mode, why not measure them in pulse mode?” Pulse mode measurements are frequently done for power transistors in order to be able to characterize the device under biasing conditions which would cause excessive dissipation in continuous mode. The beautiful thing is that when the tubes are measured in pulse mode all of the bulky high voltage power supplies can be eliminated. Instead a low power boost converter can be used to charge up a reservoir capacitor which can easily deliver several hundreds of milliamps during the few milliseconds necessary for the measurements.
This was how the idea for the uTracer was born. The past half year has been spend on doing experiments, developing circuits and writing code to make the uTracer a reality. During this half year (first half of 2011) sI have posted the progress of this work on a sort of a weblog on my site. For the average reader however, who is not so much interested in the failures and “thoughts” behind the uTracer circuit, this page simply contains too much information. This page has been added for those who find it difficult to distill the relevant project information necessary to copy this project. It contains a brief description of the uTracer’s hardware, its working, construction details and a short user manual of the Graphical User Interface (GUI).
| to top of page | back to homepage | to the full project page |
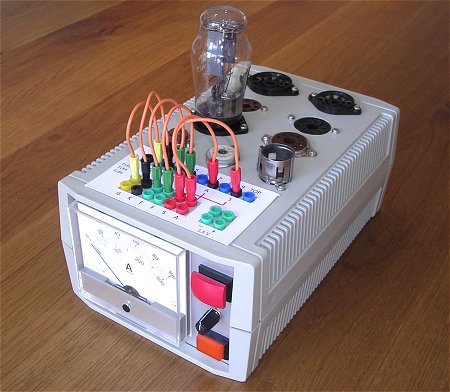
The idea was to make a device, as small and cheap as possible, that can measure all the relevant tube characteristics. Since the tube is not operated in a continuous mode, but only sampled during pulses of about a millisecond, there is no need for “heavy” power supplies so that all the hardware can be placed on a PCB the size of a postcard. The total system consists of four components: first of all the dedicated uTracer hardware, as said a PCB the size of a postcard, secondly a rather “sturdy” power supply in the form of an old 19.5 V Dell Laptop power supply, an array of tube sockets depending very much on the taste of the user, and finally a Graphical User Interface (GUI) running on a PC or Laptop. The uTracer is connected to the PC via an RS323 link and all communication with the uTracer is via the GUI.
The uTracer is designed to measure all kinds of curve characteristics. The most commonly known are plots of the anode current as a function of the control grid voltage and the anode current as a function of anode voltage for different grid bias values (so called output curves). The uTracer is however capable of measuring many other curves such as for instance the anode current versus the filament voltage! The basic specifications of the uTracer are that it can measure at anode and screen grid biases from 20 to 400 V at currents up to 200 mA (anode) or 50 mA (screen grid). Control grid biases can be chosen between 0 and -60 V, while the filament voltage can be anywhere between 0 and 19.5 V at 1.5 A current.
Figure 2.1 Principle of the µTracer.
The heart of the uTracer hardware is shown in the schematic circuit diagram of Fig.2.1 (left). The high voltage for the anode and the screen grid are generated by two boost converters which basically consist of a high voltage MOSFET, a switching diode and an inductor. The boost converters charge two large 100uF / 400 V reservoir capacitors which deliver the current during the actual measurement. The operation of the boost converters and the charging of the reservoir capacitors is completely controlled by a PIC microcontroller so that the voltage of the reservoir capacitors can be chosen anywhere between 20 and 400 V. During the charging of the capacitors the control grid of the tube is kept at such a low potential that the tube is completely cut-off. As soon as the reservoir capacitors are charged, the control grid is pulsed to a certain (negative) bias value. This will cause the tube to conduct resulting in an anode and screen grid current. These currents cause a (small) voltage drop over a series resistor. This voltage drop is first level shifted by two 1 uF capacitors and then buffered by two inverting OpAmps. The actual anode and screen current values are subsequently measured and stored by the PIC controller. In reality the measurement of the currents is a bit more complicated. The anode and screen grid currents also slightly discharge the reservoir capacitors. This voltage drop adds to the voltage drop caused by the currents of the sense resistors. Since the voltage drop over the sense resistors disappears after the measurement pulse is over (tube cut-off again) and the voltage drop due to the discharging of the capacitor remains, it is possible to distinguish between the two. This requires a measurement of the voltage during and immediately after the pulse. In reality also the voltage immediately before the measurement pulse is measured to compensate for offsets. The sampled voltage values are sent to the GUI which performs the required math. Click here for more info.
The circuit for the rest contains a few blocks which are not shown in Fig.2.1. They include the control grid pulse generator, two inverting boost converters, one for negative power supply for the OpAmps and one for the negative grid bias, the micro controller and the filament supply. The filament supply simply consists of a power Pulse Width Modulator (PWM) which pulse width modulates the 19.5 V power supply from the Dell cord adapter. In this way the filament supply voltage can be chosen between 0 and 19.5 V. Since a cord adapter can easily supply 3 A, driving a filament for e.g. an EL34 which consumes about 1.5 A at 6.3 V is no problem at al. Click here for more info.
| to top of page | back to homepage | to the full project page |
The circuit diagram of the uTracer consists of two parts, the analog circuit and digital part. The digital part is not really interesting and will be discussed further on in this section.

Figure 3.1 Circuit diagram of the analog part of the uTracer (version 3.2 dd. 10-07-2011). Click here to download the circuit diagram in pdf format.
Figure 3.1 shows the analog part of the uTracer circuit. At first sight it seems to consist of a rather intimidating number of components, but the circuit itself is really not that complicated and actually quite easy to understand. Furthermore, it mainly uses very simple of-the-shelf components. The circuit itself consists of a number of blocks which more or less operate independently. Here, in this project summary, I will just briefly discuss every block and its function, and I will add a link to the corresponding section in the “project-blog” page for readers who would like to know more about the topic.
The top row of components in the circuit diagram constitute the screen bias generator and the screen current sense resistors and amplifier. The boost converter for the generation of the screen bias consists of the components around T1, L1, D1 which charge the reservoir capacitor C2 which actually supplies the screen current during the measurement pulse (more info). The resistive voltage divider R4/R5 reduces the 0-400 V range to a, for the AD input of the micro controller more acceptable, 0-5 V (more info). By switching on T2 it is possible to (partly) discharge the reservoir capacitor should the voltage be too high. All these components are controlled by the micro controller so that the screen voltage exactly corresponds to the set point value (more info). Resistors R6 and R7 are the screen current sense resistors. For the high range (0-50 mA) S1 is closed, for the low range (0-5 mA) S1 is opened so that R6 and R7 are switched in series (more info). Capacitor C5 level shifts the (negative) voltage pulse over the sense resistors to ground potential, and OpAmp IC1 inverts it to a positive pulse (more info). The Schottky diodes clamp the output of the OpAmp to Vdd and Gnd (more info). In the breadboard version decoupling capacitor C19 (and C20) was necessary to prevent the tube from oscillating (more info). In the final perfboard version it appeared that these capacitors caused oscillations so that they were removed. Below top row of components in Fig. 2.1 we find an almost identical circuit constituting the anode bias generator and current sense circuit. Apart from the values of the current sense resistors, this circuit is identical to the top one.
In the lower right hand side of Fig. 3.1 we find the filament supply circuit. As mentioned earlier the filament is driven by pulse width modulating the 19.5 supply voltage. The basic PWM signal is generated by the micro controller and buffered by T16 and T17 which drive the modern and efficient power MOSFET T18 which is the real PWM switch. The filter consisting of L5 and C14/C15 smoothens out the very high current peaks which can be caused by switching the low resistivity filament, especially when it is cold (more info).
On the lower left hand side of Fig. 3.1 we find the inverting boost converters. Transistors T7/T8 together with L3 and D7 generate the unregulated negative supply voltage for the OpAmps (more info). Also this converter is completely under software control which keeps the output voltage constant at ca. -20 V. IC5 and IC6 provide a nicely regulated +/- 15 V supply for the analog electronics. The negative bias for the control grid is generated by the other boost converter (T9, T10, L4, D10 and C10). The output voltage of this converter is switched under software control between -20 V and -65 V depending on the range selected for the grid bias (more info).
The remaining components in the circuit take care of the control grid bias pulse. This circuit is a bit more complicated so that only the basic working will be discussed here (more info). The height of the control pulse is controlled by a PWM signal generated by the micro controller. The second order low-pass filter around IC4 converts this PWM signal to a DC voltage between zero and 5 V. When T15 conducts, this voltage is pulled against Gnd and as a result the control grid is at its cut-off potential of -15 V (low range) or -60 V (high range). The circuit around T11-T13 and IC3 generates the actual control grid pulse. The exact relation between the PWM signal generated by the micro controller and the control grid pulse height is a bit tricky, but completely under software control (more info).
Figure 3.2 The digital part of the uTracer.
The digital part of the uTracer is probably the least interesting part of the whole project. The controller is a PIC16F874 used in standard configuration running at 20 MHz (Fig. 3.2). The uTracer interfaces with the GUI via an RS232 link provided by the on-chip USART and a classic MAX232 line driver/receiver. In this project I used the in-circuit programming option to load the firmware into the controller. The programmer I use has been for many years the “Wisp” programmer designed by Wouter van Ooijen. I use a homebrew version, but a very moderately priced (30 euro) kit is available from his webshop (look under “kits”). Several windows programs have been written to operate the “Wisp” programmer. I personally use the Bumblebee program written by Demian Kuipers. Both the kit as well as the software are a great way to start with PIC micro controllers, heartily recommended!
| to top of page | back to homepage | to the full project page |
Unfortunately I do not have a PCB for the uTracer (yet). A always build all my projects on perfboard. This requires a bit more skills and time than building a circuit on a PCB but I find that it takes my mind of things and that it relaxes me. Besides that I take particular pride in trying to make the perfboard circuit a tidy and neat as possible. However, I discovered that many people are interested in the project so I am playing with the idea of actually designing a PCB in this case.
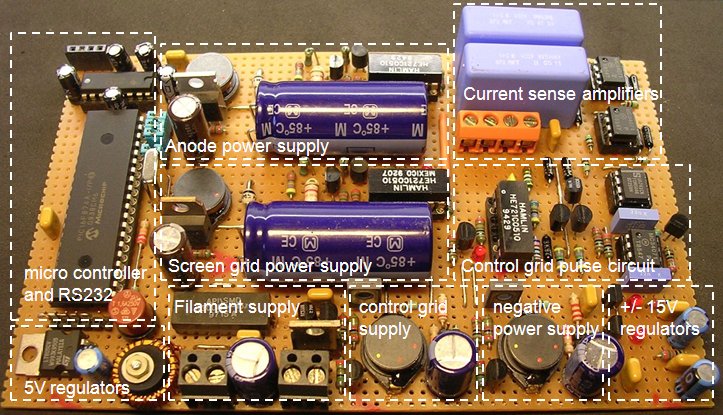
Figure 4.1 The uTracer circuit on perfboard
Figure 4.1 shows the uTracer perboard PCB (more pictures here.) All components have been logically grouped together. The layout of the circuit is not critical, but a few important things have to be taken into consideration. In the first place it should be remembered that certain parts of the circuit carry very high voltages in excess of 400 V. Take care that in the layout of the PCB there is always enough physical distance between the high parts of the circuit which carry the high voltage and the low voltage part! I myself have as a rule of thumb that there should be at least two “DIL” gaps in between them. Secondly, certain parts of the circuit, especially in the filament supply carry very high peak currents, up to many amps. Keep those lines short, and connect them directly to the power supply terminals. And finally, avoid ground loops! Take the ground power supply terminal as the central grounding point and connect as much as possible all grounds directly to this point (“star” grounding).
Apart from the 1% (or better) resistors, the selection of the components is not very critical. For most of the components I used what I had lying around. The BF487 can be replaced by any small signal npn with a BVceo of 400 V or more such as a KSP44, MPSA44G, or an STX616. If you want you can even replace the BF487 by an IRF840 MOSFET. The base resistor can be omitted in that case. For all other BC-type transistors practically any “small signal” npn or pnp transistor can be used which is “common” in your part of the world. The inductors are always considered to be a “difficult” component. I salvaged the inductors I used from an old PCB. If you buy one, take care that the saturation current of the inductor is at least 1 A. Preferably use an inductor with a somewhat higher saturation current such as 1.2 A. Most likely good inductors are this one from Coiltronics, and this one from Epcos, and this one from Multicomp. The relais are also non critical, I just used what I had available, any 5V “pcb relais” may be used. The relais I used had a flyback diode build in, for other relais you may need to add it. Just for the simple fact that I had a whole bunch of MC34071 OpAmps lying around, I used that type. Any descent +/-15V OpAmp may be used, probably the three MC34071 OpAmps can be replaced by a single LM324. For IC3 a good old LM741 worked best. Also instead of the BYW96E any other fast swicthing diode that can block 450 V can be used such as a BY299, a BYT56M or a BYV38. For the MOSFETs, I recommend the specified types which have been chosen for optimum price performance ratio.
As mentioned before, I used an old 19.5 V Dell Laptop adaptor to power the uTracer. They can supply up to 3.5 A and they should be easy enough get hold of. In some cases the tube under test tends to oscillate. Martin Forsberg kindly pointed me to the service manual of the AVO Mark IV tube tester where it is explained how oscillations in that tester are suppressed:
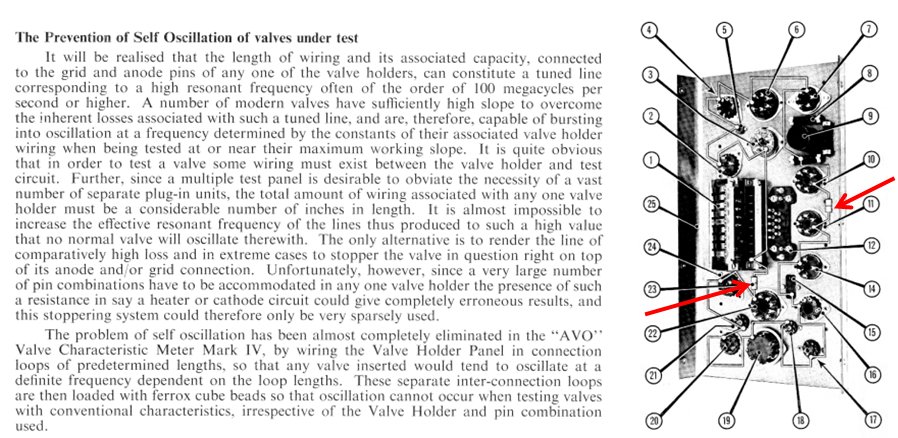
Figure 4.2 Excerpt from the AVO Mark IV service manual
By running the wiring of the tube sockets in loops of a fixes length and Adding ferrox cube beads at certain points (red arrows in Fig. 4.2) oscillations are effectively suppressed. A sound advice which I intend to follow!
| to top of page | back to homepage | to the full project page |
The uTracer is operated with the Graphical User Interface (GUI) running on a PC. The GUI is written in Visual Basic 6.0. The GUI communicates to the uTracer via an RS232 serial link. To run the GUI just copy the executable in an empty directory and double click it. If everything works as it should, the form shown in Fig. 5.1 should appear. On this page only a short summery of the operation of the program is given, a more complete description can be found here.
Figure 5.1 Overview of the User Interface Form.
A Short User Manual
I have tried to keep the operation of the uTracer as simple as possible. The GUI form is divided into three frames: The “measurement setup” frame, The “Curve output” frame and the “Communications” frame. A measurement starts by selecting a measurement type (Fig. 5.2). Selecting a measurement type automatically loads the default values for the different measurement variables. The primary variable is the variable which is plotted against the X-Axis. For this variable the start and stop values can be modified, together with the number of measurement points. By default these measurement points are equally distributed over the measurement interval. By checking the “log” checkbox a logarithmic distribution is generated. In case more than one curve is measured e.g. when a set of Ia(Vgrid) curves is measured for different anode voltages, these anode voltages can be entered in the field titled “stepping variable.” The values in this field need to be separated by a space.
Figure 5.2 The MeasurementSetup frame.
There is at this moment no automatic range selection implemented. When the user expects the anode current to be higher than 20 mA, or the screen-grid current to be more than 5 mA, the appropriate checkbox has to be checked. This automatically means that all the measurements are performed with the uTracer set in the high range, and thus with the lower resolution. If the currents are below the indicated values it is therefore better to leave the boxes un-checked and go for a higher resolution. Finally, a delay can be specified which is added in between every measured data point. This delay can be used e.g. in an Ia(V_filament) measurement, to give the filament time to reach its equilibrium temperature.
The command button marked “Measure Curve” in Fig. 5.2 has a double function. Before the first measurement, its caption reads “Turn on Filament.” When it is clicked, a command string is send to the uTracer to switch on the filament with the filament voltage specified in the first entrance in the measurement matrix. When e.g. a filament voltage sweep is made from 1 to 10 V, the first voltage applied to the heater is 1 V. In most cases the filament voltage will obviously be constant, so that the constant value is used. After the “Turn on Filament” button has been clicked, its caption changes to “Measure Curve.” When it is clicked again, the actual measurement is started. When the “Abort” button is clicked the measurement is stopped at once, but the filament is still on. Clicking the “Abort’ button again also switches off the filament.
Figure 5.3 The Curve Output frame.
The “Curve Output” frame displays the measured data. By default only the anode current is displayed (solid line, open markers). By (un)checking the “show Ia / Is” boxes any combination of Ia / Is curves can be plotted. The Is curve is represented by a dotted line with open markers. Below the graph the minimum and maximum values for the axis can be entered. Some elementary checking of the entered values is done based on the selected measurement type. The upper row of preset buttons offers the possibility to quickly change the axis of the graph for Ia(V_anode) type of measurements. The lower row of preset buttons is meant for Ia(V_grid) type of curves.
By clicking the “Save Data” button the entire measurement matrix is written to an external file for further processing e.g. in Excel. Each row in the data file - which has the extension *.udt (uTracer data file) – represents a single measurement. The first column gives the measurement number within each curve, while the second column gives the curve number. The next six columns give the anode- and screen currents (in mA), and the grid, anode, screen and filament voltages. By clicking the “Store” button, the entire measurement matrix is copied into a second data matrix (dblStoreMX) which is internal to the program. By clicking the “Recall” button the stored data in this matrix can be added to the plot (closed markers). In this way it becomes possible to compare characteristics of different tubes. After the “Recall” button has been clicked, its caption changes to “Dismiss”. Clicking it again removes the stored data from the graph, but does not erase the stored data.
Figure 5.4 The Communications frame.
The last frame, the Communications Frame, has been added mainly for debugging purposes. It allows for a detailed examination of the communication between the GUI and the uTracer. The only input fields are a dropbox which allows the user to select the desired COM port number, a command button to force closing of the COM port, and a check box which when checked introduces a 2 seconds delay after each measurement command (used for debugging purposes). If for one reason or the other a character is lost in the communication with the uTracer, it is possible that the uTracer remains waiting for a character that will never arrive. To reset the uTracer in such a case the “esc” button can be used. This will send an “esc” character to the uTracer. Reception of an esc character will always force a reset of the uTracer. For more information on the meaning of the other fields in this frame click here
Figure 5.5 Anode current (left) and screen current (right) versus anode voltage for an EL84 measured with the uTracer (Vs = 200V).
Figure 5.5 shows by way of illustration a measurement made with the uTracer on an EL84 output tube. These are just two examples of the many measurements possible with the uTracer. Note that for measurements in which the anode or screen voltage is the first variable, the lowest voltage that can be applied is equal to the supply voltage (ca. 20V) due to the construction of the boost converters.
| to top of page | back to homepage | to the full project page |
The uTracer hardware doesn’t run without the proper firmware in the microcontroller, and to operate the uTracer you need the Graphical User Interface. Both programs have been packed in a zip file which can be downloaded by clicking here. It contains the following files:
| to top of page | back to homepage | to the full project page |
I think that this project clearly demonstrates the feasibility of a small pulse tube curve tracer as I had it originally in mind. The uTracer presented on this page can be build for (much) less than 50 euro, and although there are obviously much better and more accurate test instruments on the market, it is the ideal tool to quickly get an idea of the characteristics of a particular tube. If you have like me, a box (boxes) full of old tubes, and you are curious to find out if “they still play,” then the uTracer is just the perfect tool. The present (version 2) uTracer is naturally not perfect. I have learned a lot from this project, especially how some things can been done better (more info). In the mean time work has started on the uTracer version 3. Again I will try to keep a Weblog of the progress if only for my own documentation.

A poorman’s Terracotta Army