|
|
ECC83 Double Triode
The ECC83, or the 12AX7 as it also known, is a much loved tube amongst vacuum tube audiophiles. It was developed around 1948 by R.C.A. and subsequently copied and perfected by Philips-Mullard in Europe. The tube has a very high amplification (mu > 100) mainly as a result of its high output impedance. With its low bias current of 1.2 mA the tube is mainly used in resistor coupled pre-amplifiers and phase-splitters
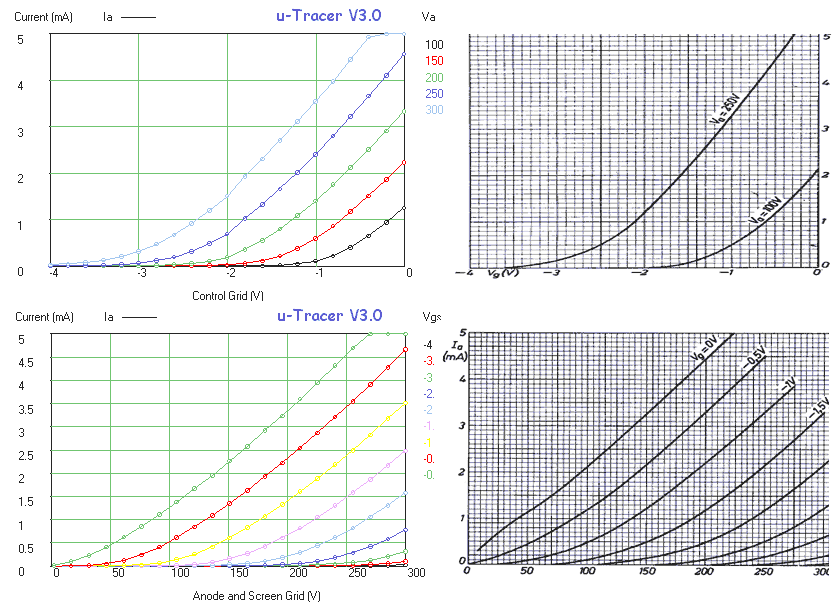
Figure 1 Ia(Vg) and Ia(Va) curves of an ECC83 (12AX7) compared to the curves in the original datasheet (Source: Franks Tube Data).
In Fig. 1 both the Ia(Vg) curves as well as the output curves are compared to the original datasheet. Note that my ECC83 draws a bit less current than the current specified in the datasheet. From these measurements it is clear to me that the next important addition to the GUI will be the measurement of the transconductance and the output resistance and thus the amplification. However, I still haven’t made up my mind how to do that exactly. Directly differentiating the Ia(Vg) and Ia(Va) curves can result in a mess when these measurements are a bit noise. What I plan to do is first fit a polynomial to the curves and then to differentiate them numerically.
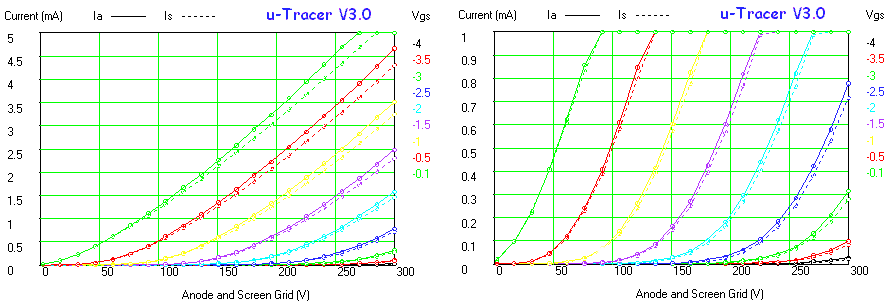
Figure 2 Left: output curves for each of the sections of the ECC83. Right: same measurement but then at 0-1 mA scale.
One of the nice features of the uTracer is that it is possible to measure both sections of the double triode simultaneously by simply connecting the anode of the second section to the screen connection on the uTracer. Using a special measurement type (see section of resistor measurement above) both Va and Vs are swept simultaneously. The left graph of Fig. 2 shows a comparison of the output characteristics of both sections of a single ECC83. As can be seen there is a small difference between the sections. I have no idea if this difference is significant for high-quality audio amplifiers. One of the nice things of the auto-ranging option is that all measurement point are taken with the same accuracy. It is therefore directly possible to zoom in on the measurement as shown in the right graph of Fig. 2 where using the same set of measurement point the current scale as been magnified to 0-1 mA.
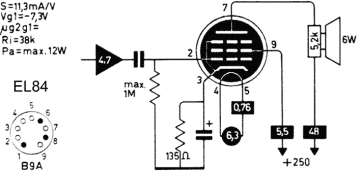
The transconductance of an EL84
The transconductance of a tube is the variation in anode current as a result of a small variation in gate voltage at a certain bias point, which is nothing more than a combination of DC grid and anode voltages. In other words, it is the slope of the anode current versus grid voltage at a specified bias point. In mathematical terms: the transconductance is the first derivative of the anode current with respect to the grid voltage.
This simplest way to measure the transconductance is to draw a line through two consecutive data points on the Ia(Vgs) curve. The transconductance is then nothing else than slope of this line. However, differentiating a measured curve this way usually results in a very noise transconductance curve as a result of (small) fluctuations in the measured data. In the version 3 uTracer I have therefore used a slightly different approach. After measurement of a set of Ia(Vgs) curves, first a polynomial is fit through the measurement points. This polynomial smoothes out the fluctuations in the measured data. After the fit the polynomial is analytically differentiated resulting in a perfect noise free transconductance curve.
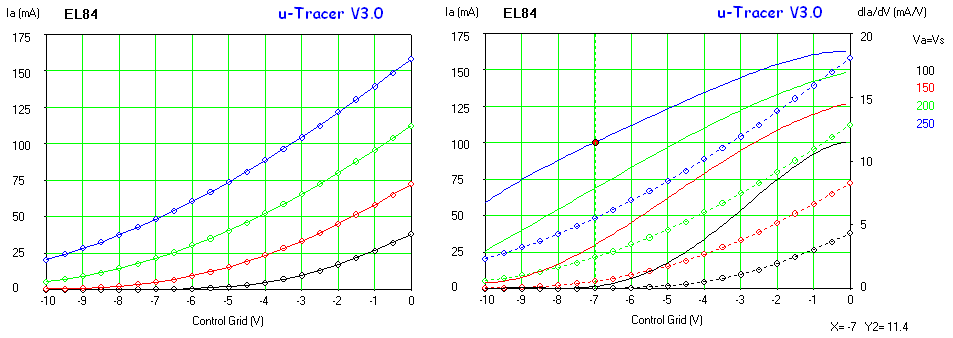
Figure 3 Left: Ia versus Vg set of curves for an EL84; Right: extracted transconductance (solid lines) and anode current (dashed lines)
Figure 3 shows an example of a transconductance “extraction” from a set of Ia(Vgs) curves. The original set of curves is shown on the left. The first step to extract the transconductance is to determine the degree of the polynomial to be fitted. The degree of the polynomial can be set to any value between 1 and 25! I usually do this by trial and error. I usually plot the data on the Y1-axis and then switch off the line so that only the markers are shown. On the Y2-axis the fitted anode
 current is plotted with the markers switched off. In this way it is easy to compare the fit to the measured data. A 5th order polynomial usually gives a good result. The order of the polynomial should not be chosen too high because that will result in oscillations in the transconductance curve. When the fit is ok, the derivative of the current to the voltage (dIa/dV) can be plotted. An alternative way to find the optimum polynomial degree is to directly plot the transconductance, and
then to vary the polynomial degree. At first increasing the order of the polynomial should result in a significant change in the transconductance curves. At a certain point the curves will not change anymore when the order is increased. However, when the order is increased again beyond a certain point oscillations in the transconductance curves will appear. The most optimal point is somewhere in the flat part where the transconductance is relatively independent of the degree of the polynomial. The right graph in Fig. 3 shows the extracted transconductance (solid lines) and the original anode current as a function of grid bias. The marker shows the transconductance at the bias point recommended in my “Muiderkring” tube handbook (see inset) Vg = -7 V and Va = Vs = 250 V. Both the transconductance as well as the anode current are exactly the same as the values mentioned in the handbook, respectively 11.5 mA/V and 48 mA, which shows what an accurate and useful instrument the uTracer is!
current is plotted with the markers switched off. In this way it is easy to compare the fit to the measured data. A 5th order polynomial usually gives a good result. The order of the polynomial should not be chosen too high because that will result in oscillations in the transconductance curve. When the fit is ok, the derivative of the current to the voltage (dIa/dV) can be plotted. An alternative way to find the optimum polynomial degree is to directly plot the transconductance, and
then to vary the polynomial degree. At first increasing the order of the polynomial should result in a significant change in the transconductance curves. At a certain point the curves will not change anymore when the order is increased. However, when the order is increased again beyond a certain point oscillations in the transconductance curves will appear. The most optimal point is somewhere in the flat part where the transconductance is relatively independent of the degree of the polynomial. The right graph in Fig. 3 shows the extracted transconductance (solid lines) and the original anode current as a function of grid bias. The marker shows the transconductance at the bias point recommended in my “Muiderkring” tube handbook (see inset) Vg = -7 V and Va = Vs = 250 V. Both the transconductance as well as the anode current are exactly the same as the values mentioned in the handbook, respectively 11.5 mA/V and 48 mA, which shows what an accurate and useful instrument the uTracer is!
Exactly the same procedure is followed to extract the output conductance of a tube. In that case the anode current is measured as a function of anode voltage. Since it is more common to give the output resistance it is also possible to plot the reciprocal of the conductance: dV/dIa.
EM84 – testing Magic Eyes
Like so many other admirers of vacuum tube technology, I have “a weak spot” for Magic Eyes. I find them fascinating tubes, but then again I have a passion for every tube which in one way or the other emit light. Testing of a magic eye in the sense of taking its I-V curves usually doesn’t make much sense. The big question usually is: are the phosphors and the emission of the cathode still sufficient to produce a nice image?
 To produce the green patterns displayed by a magic eye basically a high voltage power supply, a negative grid bias supply and a filament supply are needed. We have all of those in the uTracer, but unfortunately the anode supply is pulsed so that the image will be (I guess) invisible.
Testing the boost converters it occurred to me that the boost converters obviously also can generate a useful continuous current. To get an idea of how much current the boost converters can generate a 100 k resistor was connected directly across the buffer capacitor of the boost converter. It appeared that the converter could easily generate 300 V in continuous mode which corresponds to 3 mA. With a 50 k resistor the maximum voltage reached was 250 V, corresponding to 5 mA. More than enough to drive all the magic eye tubes I know. Beautiful and so simple! We only need an additional connection to the positive terminal of the buffer capacitor and a modification of the firmware and the GUI and the uTracer can also be used “to play with” magic eye tubes. It is also possible to connect the “triode” section of the magic eye to the anode terminal and the “CRT” section to the screen terminal of the uTracer. In that way both voltages can be set independently while additionally the current can be measured. Although I do not directly see what the advantage could be, of course also “low current” normal tubes can be measured in this continuous mode.
The ECL80
The ECL80 is one of the first triode/pentode combinations in a noval base designed in the early fifties probably by the tube development of Bert Dammers of the tube lab of Philips at the Emmasingel in Eindhoven, the Netherlands (more info here). The tube is a bit special because it was used as an example in the paper by Dammers on one of the first tube curve-tracers in the Philips Technical Review. The ECL80 was primarily designed for use in television receivers with the triode as a frame blocking oscillator and the pentode as a frame output amplifier (more info here). Next to this, the tube was also used in a (low-cost) audio applications.
Figure 4 ECL80 in pentode- (left) and tetrode mode (right). The screen voltage was 220V in both cases.
Unlike many other pentodes, the suppressor grid of pentode section of the ECL80 is not internally connected to the cathode, but accessible though one of the pins. This makes it possible to use this section as a normal pentode by connecting the suppressor grid externally to the cathode, or as a tetrode by connecting it to anode. The left graph in Fig. 4 shows a measurement of the ECL80 connected in pentode mode with the suppressor grid connected to the cathode. The tube has been biased a little bit below its normal bias point (Ia=17.5 mA) because in tetrode mode the kink is somewhat more pronounced for low bias values. Both the anode current and the screen current show the familiar pentode behavior. Note that for low anode voltages the screen grid takes over the role of electron collector resulting in an increase in screen current. In the right graph of Fig. 4 the suppressor grid has been tied to the anode so that the tube operates in tetrode mode. The anode current now shows the characteristic tetrode kink. The secondary emission electrons are collected by the screen grid, resulting in an increase in screen grid current, and a decrease in anode current. The anode and screen current shown an almost complementary behavior.
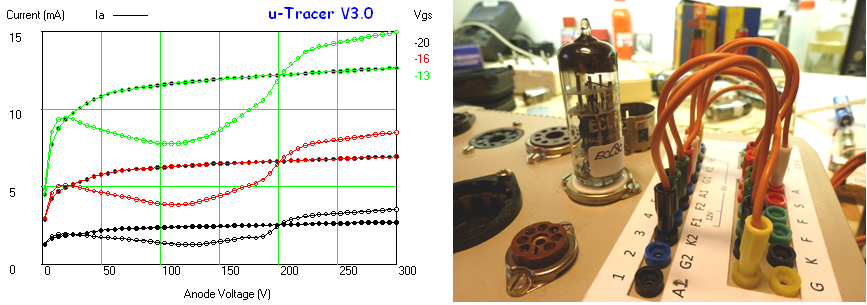
Figure 5 The anode current of the ECL80 in pentode mode compared to the anode current in tetrode mode (Vs = 220 V).
Figure 5 shows the anode current in pentode and tetrode mode plotted in the same graph. For low anode voltages, the energy of the primary electrons is low so that only few secondary electrons are generated. The anode currents in pentode and tetrode mode now almost coincide. When the anode voltage increases, secondary electrons are generated at the cathode. These electrons are attracted by the highly positive screen grid resulting in an increase of screen grid current and a decrease in anode current. When the anode voltage is increased any further, the screen grid becomes less positive with respect to the anode so that more electrons return to the anode. Now a second effect starts to play a role: the emission of secondary electrons from the screen grid. So far these electrons returned to the screen grid, however, for anode voltages higher than the screen bias these electrons are drawn towards the anode resulting in an increase in anode current to a value higher than in pentode mode. The movie below shows how these measurements were recorded. It is best viewed in full screen mode.
The VT-185/3D6, a directly heated beam pentode
The VT-185 is a nice little directly heated beam tetrode that was developed just before or in the war as a general purpose tube for portable radio equipment. It can deliver up to 2 Watt at 20 MHz or 0.5 Watt at 200 MHz, but it was also commonly used as an audio amplifier. As said it has a directly heated cathode which consists of two 1.4 V / 300 mA filaments which can be switched either in series or in parallel. After the war it was sold under the civilian tube number 3D6. It was amongst others manufactures by Sylvania and Tung Sol. I was lucky to get a hand full of them from “Radio Service Twente” in the Hague (Holland) who sells them for as little as 50 (euro) cents. Really its only drawback is that it comes in a loctal base.
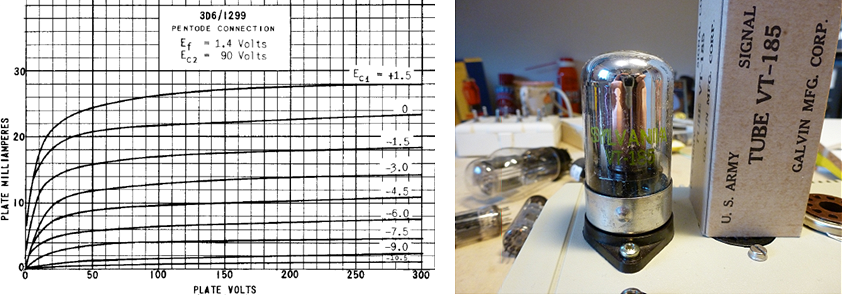
Figure 6 Output curve from the original datasheet from Tung-sol that was signed of June 1949
There is really not so much interesting to tell about the 3D6 apart from the fact that it nicely demonstrates that also directly heated cathodes can be tested with the uTracer V3. In the sets of output curves shown in Fig. 7 I didn’t use the internal filament supply, but used an external 1.5 V battery. Notice that it can make quite a difference what the polarity of the filament battery is! When the battery is connected as in the right graph, part of the filament is biased below the reference potential effectively increasing the grid bias resulting in a higher anode current. I also tested the tube with the internal filament supply. In that case I used the filaments in series. The output curves in that case were almost identical to those in the left graph of Fig. 7 because the filament supply is off during the measurement pulse.
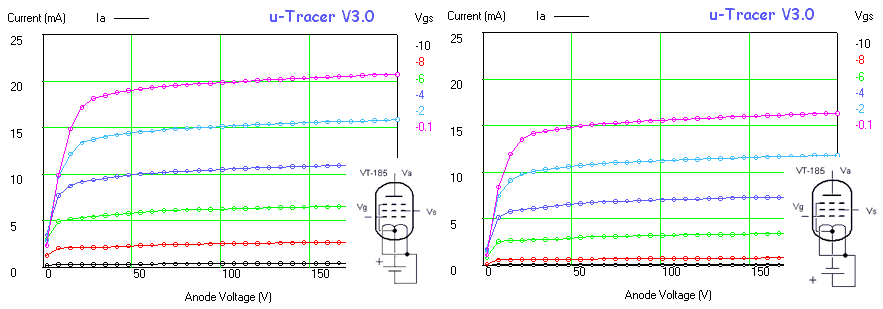
Figure 7 Output curves of the VT-185 for the two filament battery polarities.
Diodes: AZ1, EZ81, EAA91
So far I neglected the effect that the anode and screen currents have on the anode and screen voltages. There are three effects: in the first place there is the voltage drop over the current sense resistor. In the second place the currents discharge the buffer capacitors, and finally there is the voltage drop over the high voltage switch. All these three effects lower the effective anode and screen voltages. Fortunately the three voltages drop can easily be measured or calculated (Fig. 8). The voltage drop over the sense resistor simply equals the measured current times the resistance of the sense resistor. The approximate voltage of the buffer capacitor at the moment of the current measurement is also known because the voltage of the buffer capacitors is measured immediately after the measurement pulse. The voltage over the high voltage switch is approximately constant (0.7 V).
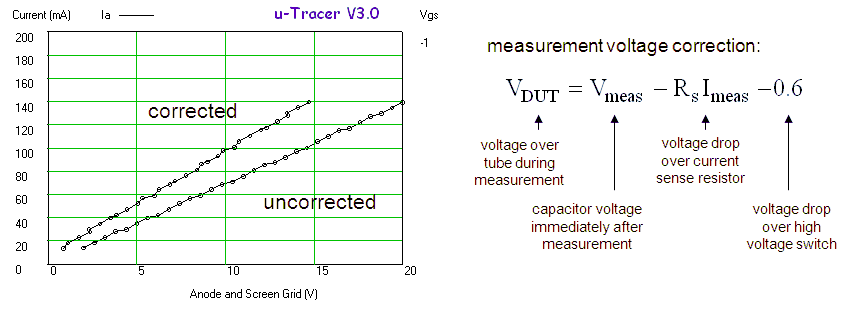
Figure 8 I(V) curve of a 100 ohm resistor showing the impact of the anode/screen voltage correction for low voltages.
So far I have neglected these effects and just plotted the currents versus the set-point voltages. The error is usually very small; for most tubes the currents are rather small, while the voltages are high. However there is at least one type of tubes for which the error can be rather large: diodes! Evidently diodes are designed to conduct high currents with a low voltage drop over the diode. The voltage drops over the sense resistor, switch and buffer capacitor can in this case be very significant.
Figure 8 shows two I(V) measurements of a 100 ohm resistor connected between anode and cathode connections of the uTracer, with and without correction of the measurement voltage. Note the large difference between the curves! Both lines appear to be less “smooth” than the normal uTracer curves. There are a number of factors involved here. First we have to realize that we are at the limits of the AD converter. With a 10 bit AD converter sized for a 380 V range the voltage step per bit is ca. 0.4 V. Looking at the “uncorrected curve” we can observe small jumps in the line about every 4 measurement points. Clearly aliasing effect related to the AD converter. The “corrected curve” obviously also suffers from the limitations of the AD converter, but additionally a correction voltage, which in itself also contains an error, is subtracted from the set-point voltage resulting in a rather ragged curve. Although the curves certainly wouldn’t make it in a beauty contest they are certainly still very acceptable and at least good enough for me.
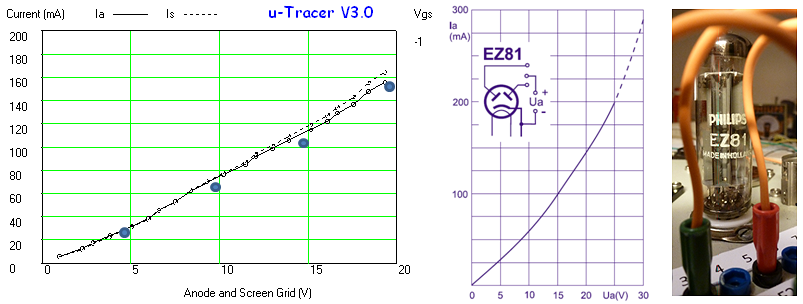
Figure 9 EZ81 full-wave power rectifier tested and compared to datasheet.
In Fig. 9 the I(V) curve of the diodes of a single EZ81 are compared to the curve from one of the datasheets. Like in the measurement of double triodes, one of the anodes is connected to the anode connection of the uTracer, while the other anode is connected to the screen connection. In this way both measurements can be compared in one measurement.
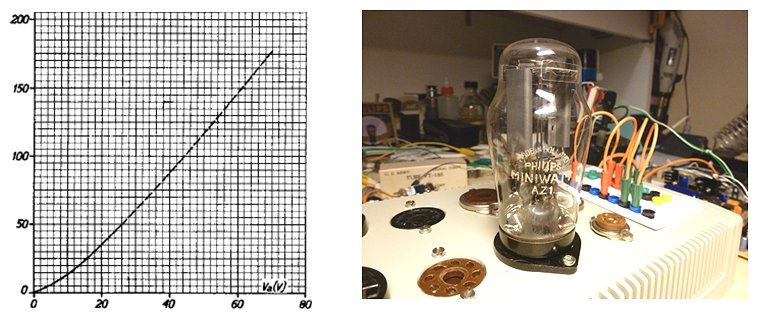
Figure 10 AZ1 “under test” and I(V) curve from datasheet
The AZ1 is a full-wave rectifier, double diode, that was introduced by Philips / Mullard in 1938. It uses the side-contacted ct8 base which was introduced by Philips, but never became a but success. It has a directly heated cathode using 4 V at 1 A. Figure 10 shows he AZ1 “undertest” and the original I(V) curve from the datasheet clipped to 200 mA.
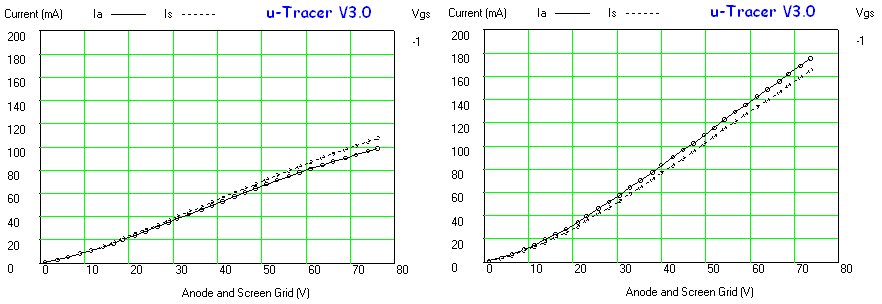
Figure 11 Two AZ1 rectifier double diodes compared.
I have a bunch of AZ1 and tested them all. Again the coupled I(Va=Vs) type measurement was used to measure both diodes at the same time. There was quite some variation in the I(V) curves. The tube in the right graph of Fig. 11 compares very well with the datasheet, producing 150 mA at 60 V drop. It is almost unbelievable how robust these guys where able to make those tubes almost 75 years ago so that they not only have survived, but actually function “as good as new.” The tube in the left graph is obviously a bit worn-out showing significantly less emission. In both cases the matching between the sections is very reasonable.
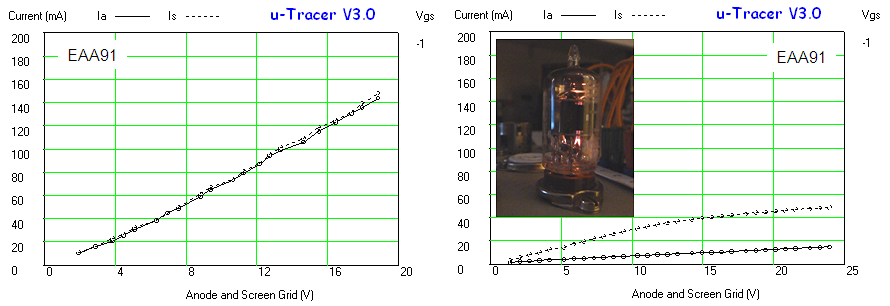
Figure 12 A good EAA91 (left) and a very bad one (right)
The EAA91 is a double diode with completely separated sections (two cathodes) intended for AM/FM/video detection which was introduced in 1951. It is a tiny tube on a 7-pin miniature B7G base. The length of the tube is only 36 mm (diameter 18 mm). A few years ago, Elector published a crystal-set receiver using the EAA91 as detector. I have tested a bunch of EAA91. Quite a number of them have a poor emission. Figure 12 shows a perfect sample (left) and a very poor one (right).
The EF50 saga
The EF50 is a landmark tube. Before the EF50 most tubes were made using the stem based technology that was also used to manufacture incandescent lamps. This technology was not particularly suitable for the fabrication of high frequency tubes. Although several tube envelopes had been proposed that were more suitable for RF operation, they all turned out to be too expensive, or not suitable for mass-fabrication. Finally the researchers at Philips succeeded in making an envelope based on a pressed glass base, which combined very good high frequency properties with low-cost, high volume manufacturability. The first tube made in this technology was the EF50. As it happened to be, this tube turned out to play an important role in WWII.
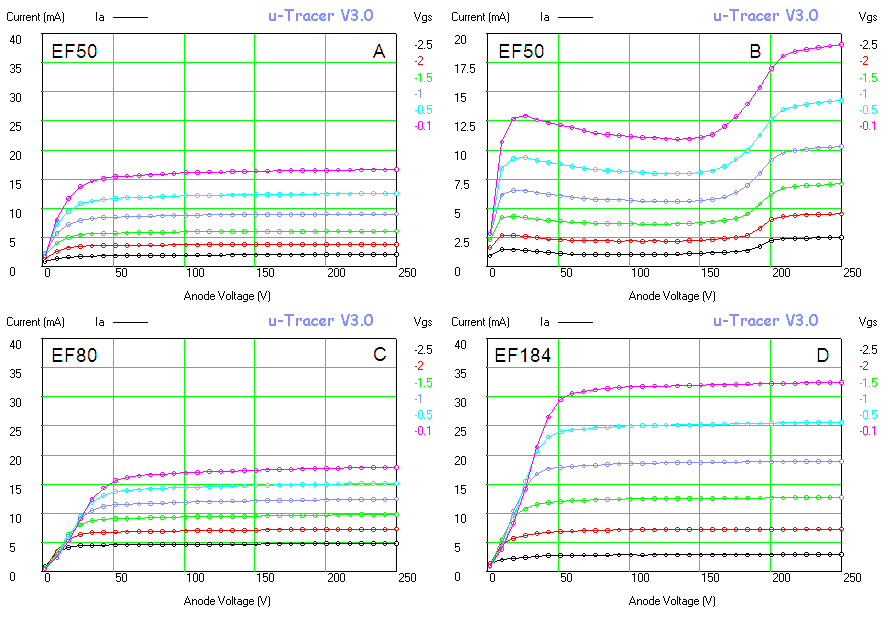
Figure 13 a,c,d: Ia(Va) curves of the EF50, EF80 and EF184 family in pentode configuration, and b: the EF50 in tetrode configuration.
Having researched the history of the EF50 in such depth, it is not surprising that it is a very special tube to me. I actually have several samples of the EF50 from different manufacturers and it was really a special moment to bring them to live using the uTracer. Like the AZ1 in the previous section the EF50 had survived the past 60 years without the slightest problem. Figure 13a shows the Ia(Va) curves of one of my EF50’s connected in pentode configuration (suppressor grid connected to cathode). In Fig. 13b the same measurement on the same tube is shown, but this time the tube is connected in tetrode configuration (suppressor grid connected to anode). Both the anode, as well as the screen-grid produce a significant amount of secondary electrons.
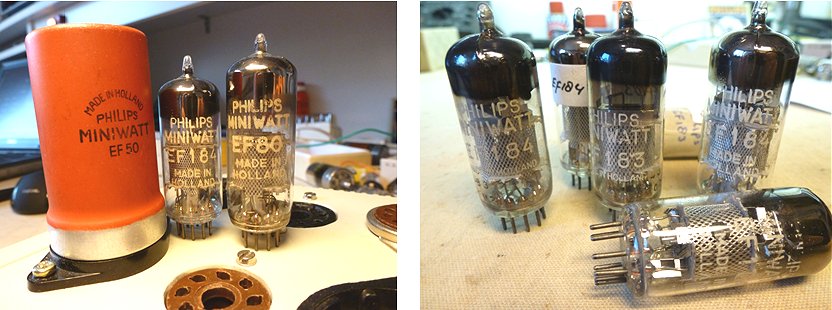
Figure 14 The EF50 and its children.
After the war, in 1950, the EF50 was succeeded by the EF80, this time in the NATO standard “noval” envelop. The EF80 was produced in enormous numbers. Most TV’s in the fifties were full of EF80’s performing a verity of functions: RF, intermediate frequency and video amplification. Like the EF50 all grids of the EF80 were accessible for optimum freedom of circuit design. In the sixties, the EF80 in turn was succeeded by the EF184. In Figure 14a,c,d the Ia(Va) curves of the EF50, EF80 and EF184 are compared. As can be seen, the mutual conductance of the EF50 and EF80 is more or less the same ca: 7.4 ma/V. From the larger distance between two consecutive sweeps in the Ia(Va) curves of the EF184 we see that the mutal conductance of the EF184 has been significantly increased (to ca. 15 mA/V).
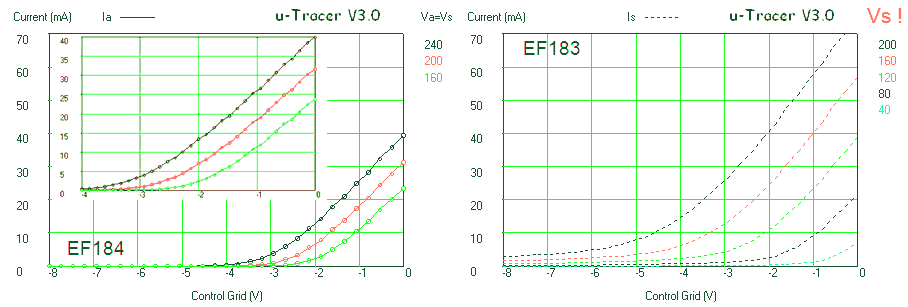
Figure 15 Ia(Vg) curve of the “straight” EF184, and its variable-mu conter part the EF183.
The EF50, EF80 and EF184 are what is called “straight” tubes, meaning that for voltages above their cut-off voltage, the anode current increases very rapidly in an almost straight line; in other words with a more or less constant mutual conductance. For these tubes it is difficult to control the gain without too much linear distortion by varying the gate voltage. Especially for Automatic Gain Control functions all three tubes had what is called a “variable mu” or “remote cut-off” counterpart where the anode current varies much more gradual with the gate voltage. This is achieved by varying the pitch of the control grid over the length of the grid. In this way different parts of the grid have a different cut-off voltage. The variable mu variants for the EF50, EF80 and EF184 are the EF51, EF85 and the EF183. In Fig. 15 by way of illustration the Ia(Vg) curves of the EF184 and EF183 pair are compared.
An “All American Five”
I could not have been older than a year or ten (forty years ago) when my father and I visited my uncle Arie, at least I think it was him. I have only a very faint recollection of the visit. The only thing that I remember is that he lived near the “Schieweg” in Rotterdam, and that during that occasion my uncle gave me an old wooden toy boat and my father an old radio. The next recollection I have of the radio is years later when we had moved from Rotterdam to Moerdijk. The radio was of American design and intended for 110-120V mains. Living in Holland, the land of Philips, such a radio was an oddity. I remember that I was surprised by the odd shape and type numbers of the tubes, which are completely different from the European style of design. Uncle Arie has always been a sailor, and most likely he took the radio with him from the States directly after the war. We had a 220 – 110 V transformer, fortunately with isolated windings because the chassis was directly connected to the mains, and I think I have heard the radio play once or twice, but always with a very poor quality. I had completely forgotten all about the radio, until by mother moved out of the house in Moerdijk where we had lived for such a long time. I took the radio with me, and it has been a kind of living room ornament since then. I once tried it, but apart from some crackling it didn’t make any sound.
Figure 16 From left to right: 12SQ7, 35Z5GT, 12SK7, 12SA7, and 35LSGT
The work on the uTracer was a nice opportunity to put the uTracer to some practical use, and test the tubes of the radio. The label on the bottom of the radio states that it is a “PILOT” model T-502. After some searching on the web I found that the T-502 is practically identical to the T-500, for which a circuit diagram is available on the internet. Also ”the radiomuseum” site has some useful information. The production date is approximately 1947, and an attractive feature of the radio is its Art Deco design. Somebody actually offered a similar radio on ebay for $495!
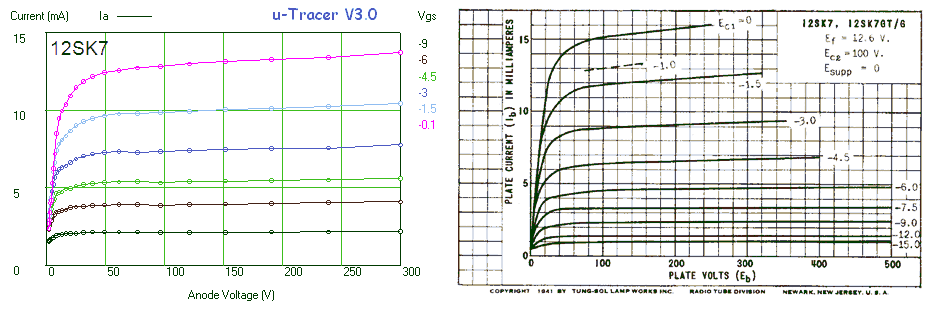
Figure 17 12SK7 Remote cut-off IF Amplifier
After surfing the web a bit more, I found that my Pilot radio is - what the Americans call - “an all American five.” What this means is that it is a kind of a minimal radio with five tubes, in which everything has been done to reduce the costs. One characteristic of this type of radios is that they don’t use a mains transformer, but that the high voltage was directly taken from the mains. Additionally, the filaments of the tubes were designed in such a way that they all operate at the same current so that all the filaments could be placed in series. Tube manufactures designed special series of tubes, called line-ups, which together made a radio, and which were designed in such a way that the total filament voltage of all the filaments in series was equal to the mains voltage. The tubes were often multi-purpose tubes which e.g. combined functions of amplification and detection, or oscillation and frequency conversion.
Notwithstanding the term “all American Five,” these sets where produced by almost any radio manufacturer, all around the world. Despite the fact that these radios were very cheap and popular, they had one huge disadvantage: the chassis was directly connected to the mains so that every contact with any metal part of the radio could be lethal!
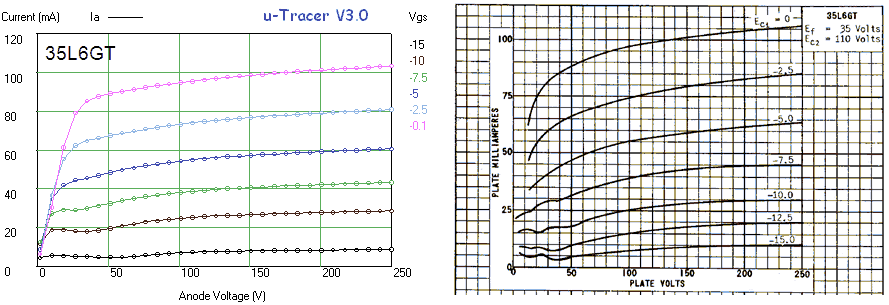
Figure 18 35L6GT Beam AF Pentode. An external power supply was used for the filament.
My Pilot T-502 contained the following tubes: a 12SA7 RF mixer/oscillator, 12SK7 Remote cut-off IF Amplifier, 12SQ7 Double-diode triode/2nd IF amplifier and detector, 35L6GT Beam AF Pentode, and finally a 35Z5GT high voltage rectifier. The 35L6GT didn’t correspond to the circuit diagram which specifies a 50L6GT. Both tubes are in fact identical, the only difference being that the first one has a filament voltage of 35 V, while the second tube has a filament voltage of 50 V. I guess that at a certain moment somebody (it must have been my father) replaced a defect 50L6GT for a 35L6GT. The lower filament voltage was compensated for by a big power resistor in series with the filaments inside the chassis. Although the 35L6GT was still perfect I will try to get my hands on an original 50L6GT to restore the radio to its original state.
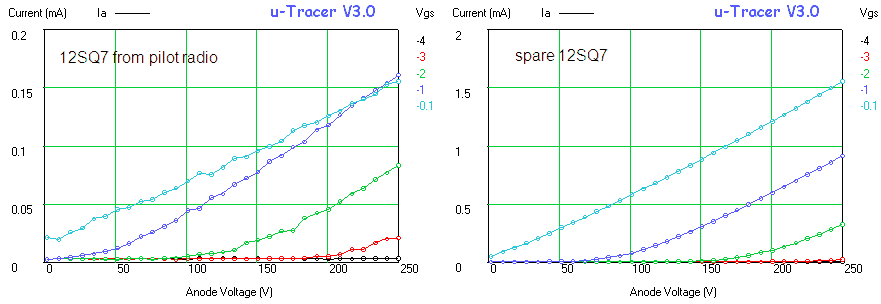
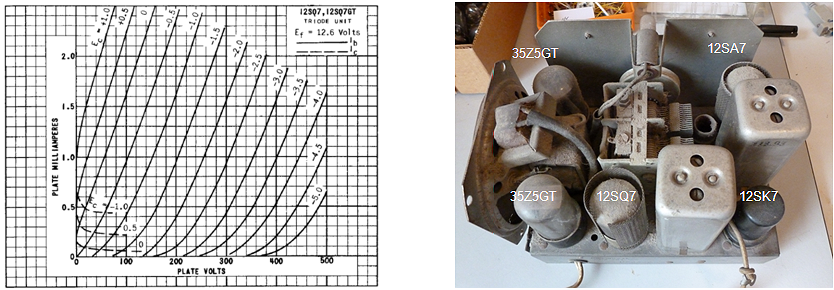
Figure 19 12SQ7 Double-diode triode, 2nd IF amplifier and detector
After some testing the culprit was quickly found: a nearly dead 12SQ7 IF amplifier/detector. For a moment I thought I was lucky because I found another 12SQ7 in my collection, but that one also had a very poor emission. In other words, the search has started for a “new” 12SQ7 to get my set playing again.
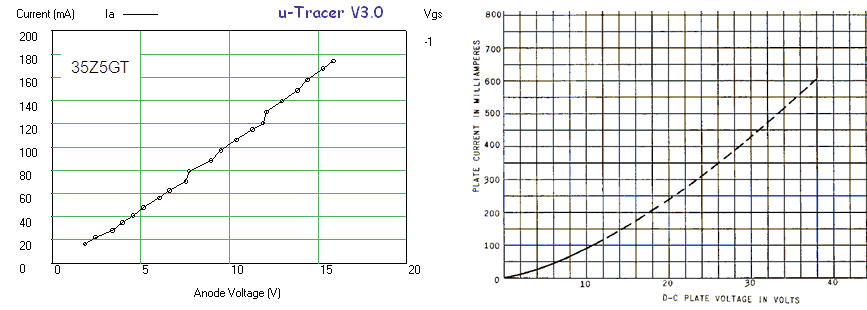
Figure 20 35Z5GT high voltage rectifiers. An external power supply was used for the filament.
Decent testing of the 12SA7 hexode (“pentagrid”) frequency changer tube was a bit less straightforward. Philips e.g. publishes DC curves of their hexodes, but these were not available for the 12SA7. However, probably for testing purposes, the datasheet states some DC characteristics of the tube in “non oscillating” mode. With the anode and screens connected to 100 V, and the grids to 0 V, the cathode current should be around 25 mA (I assumed that the suppressor grid was kept floating). Figure 21 shows a set of Ia(Va) curves of the 12SA7 tested in this configuration whereby the anode voltage was varied between 0 and 100 V, and the first control grid voltage was stepped from -7 to 0 V. The very last point measured corresponds to the point mentioned in the datasheet, and the anode very nicely matches the current specified in the datasheet (25 mA).
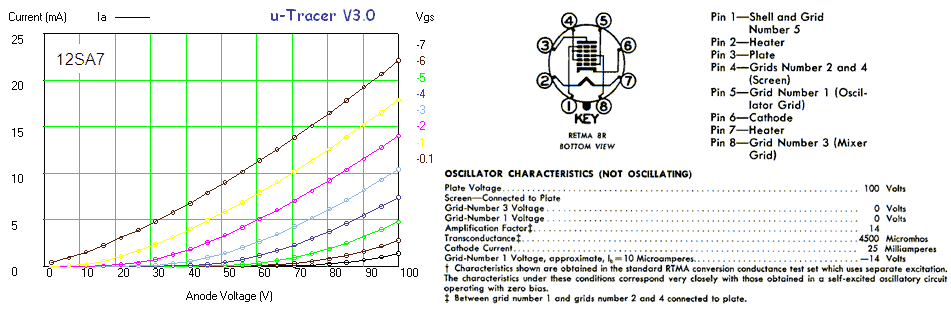
Figure 21 12SA7 RF mixer/oscillator.
The PCL85 and PCL805
The PCL85 / PCL805 is a triode / pentode combination used as frame oscillator and output stage in black and white televisions sets with 110 degree deflection. The control and screen grids have been aligned to reduce the screen current. The tube does not have an audio output rating, probably because of the rather large “tetrode kink” which is still present in the output characteristics despite the pentode configuration. That is also the reason why the tube fascinated me. The “tetrode kink” has my fascination because it is such an interesting physical phenomenon. According to the datasheet the kink could be so large the near cut-off the anode current could become almost negative!
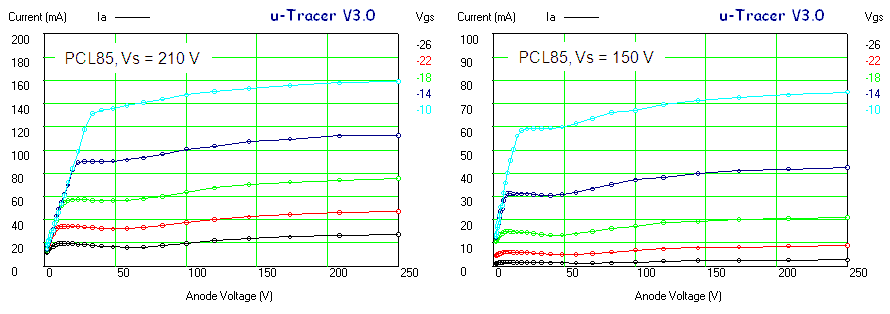
Figure 22 Output curves of the PCL85 at Vs = 210 and 170 V
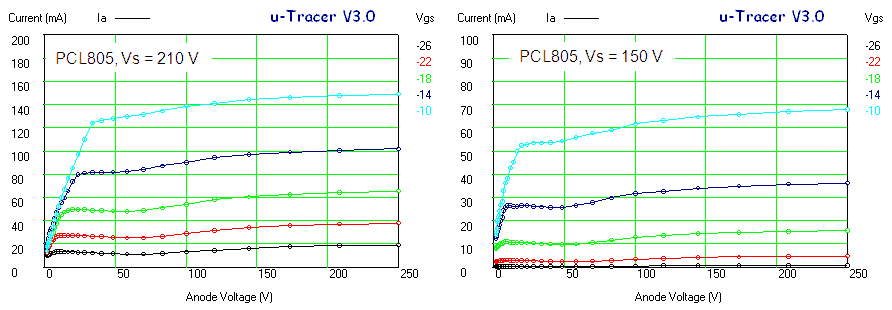
Figure 23 Output curves of the PCL805 at Vs = 210 and 170 V
I tested both the PCL85 as well as the PCL805 which is supposed to be an improved version of the PCL85. The kink turned out to be not nearly as “good” as I had hoped for. Both the tubes have a very pronounced kink which is smaller than the kink in the datasheets. The difference between the characteristics is only very small.
The ECC86, ECH83, EF97, EF98, EBF83 low-voltage car radio tube series.
Before the advent of transistors, car radios were made using radio tubes. For the generation of the high voltage a mechanical vibrator (“triller”) in combination with a transformer was used. Apart from the fact that such a circuit was rather bulky and unreliable, it also made a lot of noise, both audible and RF! No wonder that manufacturers (and custumers) jumped at the possibility of replacing tubes with transistors as soon as they became available. Unfortunately the first transistors were only suitable for application in the low frequency audio part of the receiver. In the transition phase from tube radios to fully transistorized receivers in the late fifties, Philips introduced hybrid receivers in which the RF circuits used tubes, while the AF circuits employed transistors. Special tubes were designed which could operate at anode voltages as low as 12 and even 6 V. Although these tubes were suitable for high frequency operation, they couldn’t deliver any power. That was not an issue because the transistors took care of that. In this way a completely low-voltage receiver was realized.
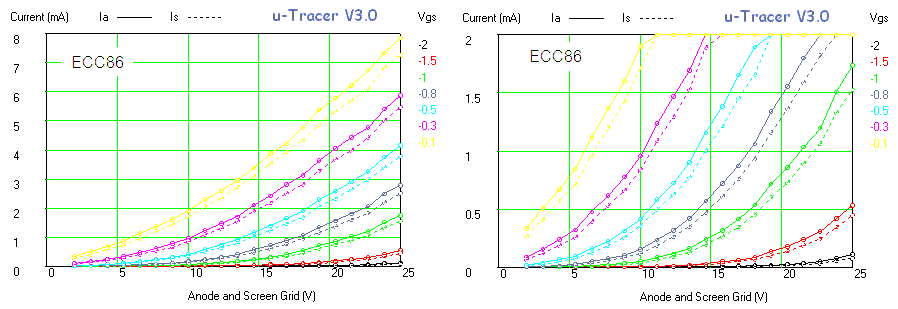
Figure 24 Ia(Va) curves of the ECC86
The low-voltage car radio line-up consisted of a complete series of tubes: the ECH83 triode-heptode frequency changer, the EF98 and EF97 IF amplifiers (EF97 var. mu), the EBF83 IF amplifier plus detection and AGC diodes and finally the ECC86. The ECC86 was used as a grounded grid VHF amplifier and self-oscillating mixer. The fabrication of these very low voltage tubes had become possible by using very tight fabrication tolerances and modern frame-grids (“spanroosters”). It appeared that the fabrication tolerances where so critical that there was quite some tube-to-tube variation. Consequently the radio had to be re-aligned after a tube change. An example of a radio which used these tubes was the
Paladin ND484VT (more info Here.)
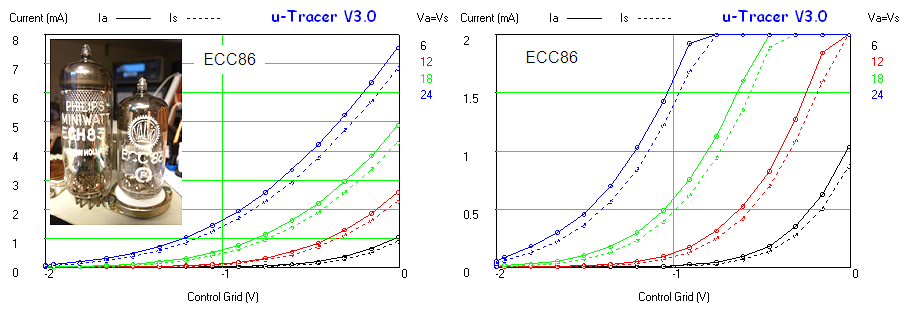
Figure 25 Ia(Vg) curves of the ECC86 low-voltage tube.
Figures 22 and 23 shows the output- and Ia(Vg) curves of an ECC86. The maximum allowable anode voltage if 30 V! Despite the very low anode voltage, the mutual conductance, according to the datasheet, still amounts to 2.6 mA/V.
The EL34, Output Pentode.
The EL34 is a 25 Watt audio output pentode. It was introduced around 1950 as the EL60 by Philips / Mullard in an “all-glass” envelop and a 9 pin Loktal (like the EF50) base. The Loktal base was not very popular so a few years later the EF60 was re-introduced as the EL34. The EL34 was and still is high popular. It was especially popular in (British) guitar emplifiers. It is one of the few years that is still in production more than 60 years after its first introduction, but not by Philips. The El34 has become a bit of a cult object amongst audiophiles, especially the original Philips / Mullard tubes. Some web shops ask crazy prices of up to $550 per tube! There are a number of excellent articles on the web on the EL34 and its history (Link 1, Link 2, Link3).
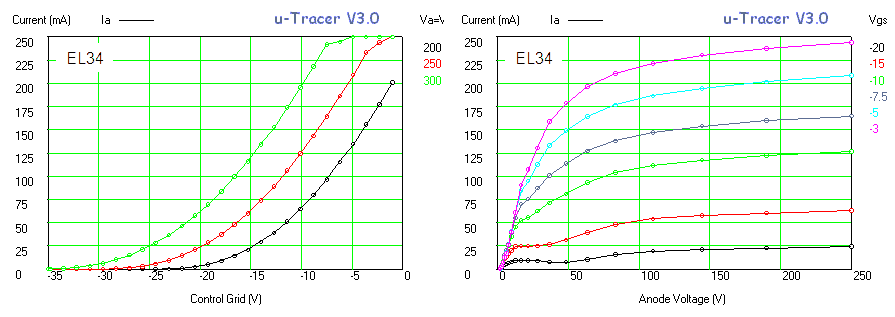
Figure 26 Ia(Vg) and Ia(Va) curves of a real nickel base Philips EL34 (Vs = 250 V).
I am lucky to own several EL34s but I never payed $550 for any of them! The tubes are specified for anode voltages up to 800 V. I tested them up to 250 V with compliance protection switched off! In this way it is possible to measure anode currents up to 250 mA when the hardware current limit kick in (observe the leveling of the anode current in Fig. 26 left for currents around 250 mA).
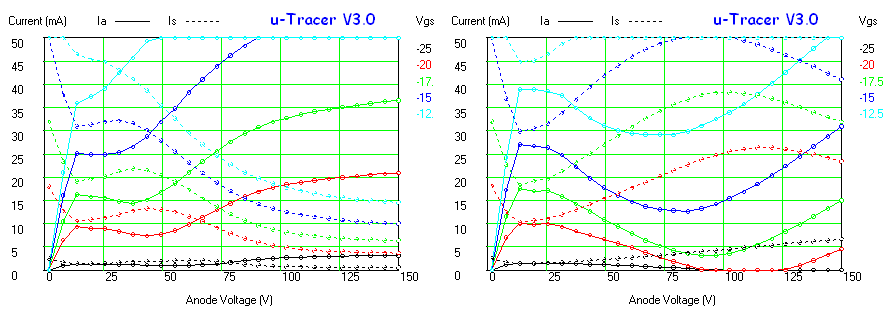
Figure 27 Close-up of the output curve for “low” anode voltages of an EL34 in pentode (left) and tetrode (right) configuration.
Interested in “tetrode kincks” I measured the EL34 also in tetrode configuration, so with the suppressor grid tied to the anode instead of to the cathode. Figure 27 shows a close-up of the output curves for “low” anode voltages in pentode (left) and tetrode (right) configuration. The drawn lines represent the anode current while the dashed lines represent the screen current. Near cut-off the secondary emission in tetrode configuration is so high that the anode current becomes negative! The anode is now literally acting as an emitter!
The EC50, Thyratron.
The EC50 is a helium filled thyratron introduced around 1939. A thyratron is a high voltage power switch very comparable to a thyristor. When the anode current is raised with the grid at a negative potential there is no anode current. However, is the grid is shortly made positive a plasma ignites and a current starts to flow limited by an external resistor. The current continues to flow even if the grid is made negative again. The plasma only extinguishes when the anode voltage is reduced to zero again.
When the tube is ignited there is a voltage drop of about 33 V between anode and cathode.
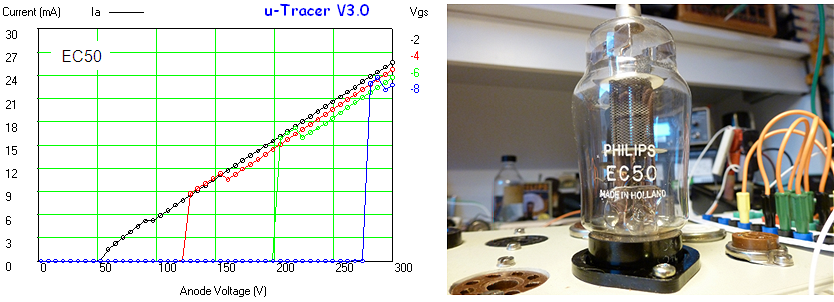
Figure 28 Ia(Va) curve of the EC50 for different Vg with an anode series resistor of 10k.
The tube can however also ignite when the anode voltage is increased beyond a certain critical value. This value depends on the negative grid bias. The more negative the grid, the higher the ignition voltage. The relation between the negative grid bias and the ignition voltage is almost linear. In Fig. 28 an Ia(Va) curve is measured of an EC50 for different grid bias values. To limit the current a 10k resistor was switched in series with the anode lead as represented by the slope of the straight line.
A comparison of two Shuguang B300 tubes
Yves Dupont used the uTracer to compare two Shuguang B300 tubes.
Both were working, the AVO Mk4 indicated a lower emission for one of the two. The uTracer shows that one is really a unusable dud and the emission for the other tube starts to nose-dive a bit on higher currents.
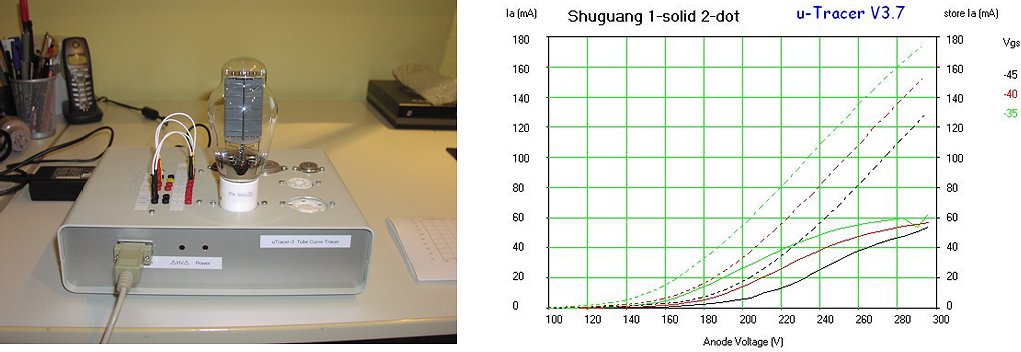
Figure 29 Comparison of two Chinese Shuguang B300 tubes
TZ-40 with positive grid bias
Figure 30 TZ-40 being tested for positive grid biases.
So time ago a friend gave me a beautiful vintage pre-WWII Taylor TZ-40 triode (Fig. 30). I want to use it to test my circuits ideas for the uTracer4. The TZ-40 is especially suitable for this since it is specified to at least a 1500 V anode voltage, anode currents up to several hundreds of mA in combination with negative and
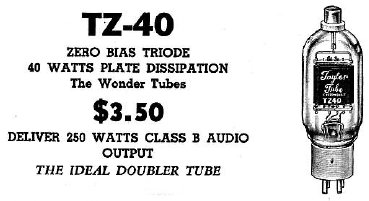 positive grid biases. The TZ-40 is quite a sizeable directly heated triode with a graphite anode. It is designed for class-B audio ( 250W a pair) or class-C RF (200W) applications. Since the tube is designed for (near) zero bias applications, the grid is positive during a large part of the phase of the signal. The datasheet therefore specifies the anode and grid currents for grid bias values up to 200 V!
Using the screen supply to drive the grid and the new measurement types of the version 3p8 GUI the TZ-40 was measured in positive grid bias mode (Fig. 31). Similar to the datasheet curves, the anode current curves surprisingly resemble tetrode curves, probably because – just as in the case of a tetrode – the anode is to some extend shielded by the constant potential of the control grid. Similar to tetrodes, the curves exhibit a kind of kink for low anode voltages. In contrast to tetrodes this kink is not caused by secondary electrons emitted from the anode, but just by electrons which are being taken up by the positive control grid, especially when the voltage on the anode is lower than the voltage of the control grid. As soon as the anode voltage increases above the control grid voltage, most electrons are collected by the anode, and the grid current shows a sharp decrease. Note that the pulsed measurement method used in the uTracer is really allowing us, perhaps for the first time, to take these characteristics because under DC conditions the grid is easily damaged for grid currents in excess of a few tens of milliamps (they are also not shown in the Taylor datasheet). Although it has (I think) little electronic interest, I added the grid current to the anode current to confirm that the grid current accounts for the “kink” in the anode current (Fig. 31 right).
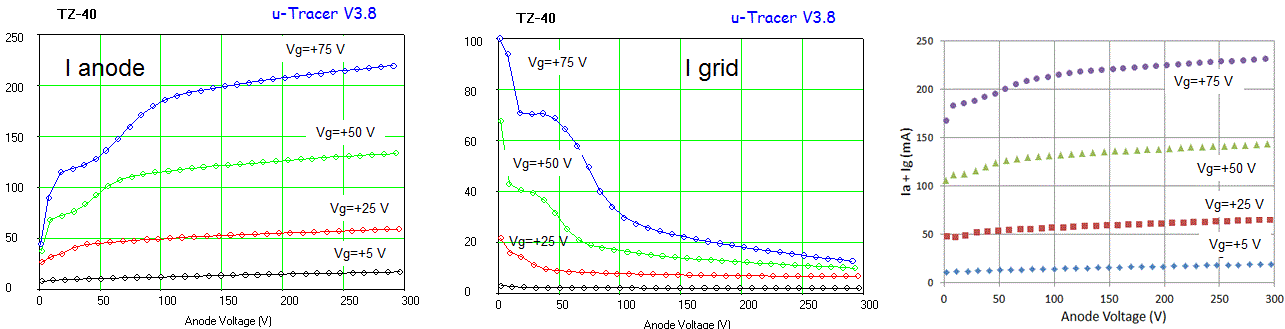
Figure 31 Anode current (left), grid current (middle) and sum of grid and anode current (right) as a function of anode voltage for a TZ-40 under positive grid bias.
KT120, an enormous modern audio pentode
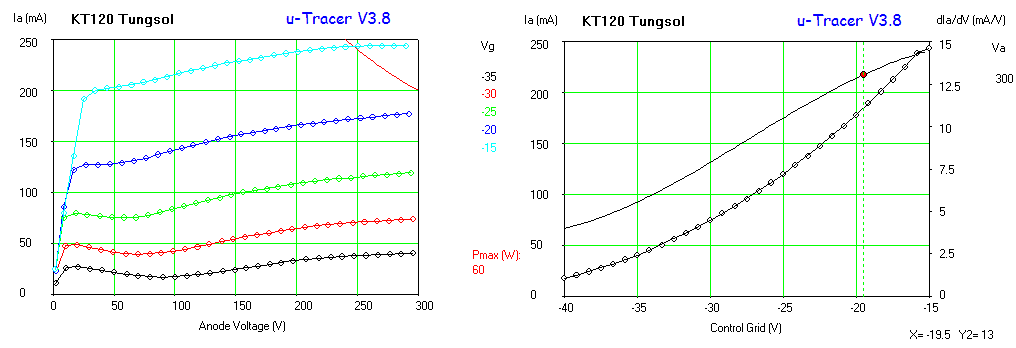
Figure 32 Ia(Va) and Ia(Vg) curves for a Tung-Sol KT120. The screen voltage in both cases was 300V.
 Personally I have little affinity with tube amplifiers and consequently my collection of tubes encompasses only the old well known audio tubes such as the EL84 and the EL34. A visit from a potential uTracer customer however, gave me the opportunity to test a modern state-of-the-art KT120 power audio pentode. The KT120 is claimed to by the most powerful audio tube in production, and in push-pull it can deliver 150W of audio power.
It is really a monster with a maximum anode dissipation of 60W and a filament current of 1.9A at 6.3V. My visitor wanted to see if the uTracer was capable of tracing this tube. The first measurement with a grid voltage of -10V immediately drove the anode supply into compliance. However, after some searching for the optimum bias conditions, we were able to trace a nice set of curves pushing the uTracer to the limits of its capabilities by driving the tube at an anode voltage of 300 V at a current of 250 mA, just into the “forbidden” dissipation regime of the tube (Fig. 32 left).
I was a bit afraid that the 1.9A / 6.3V heater would be a bit too much for the internal heater supply of the uTracer, but actually it pulled it off quite well. From the Ia(Vg) we extracted a transconductance of 13 mA/V at Va=Vs=300 V, Vg=-20V at an anode current of about 220 mA. Luckily the plots convinced my customer and he left being the proud owner of a kit. I hope to see some more KT120 plots of him in the future!
EL3010, a 90 mA/V power beam pentode by Kurt Schmid.
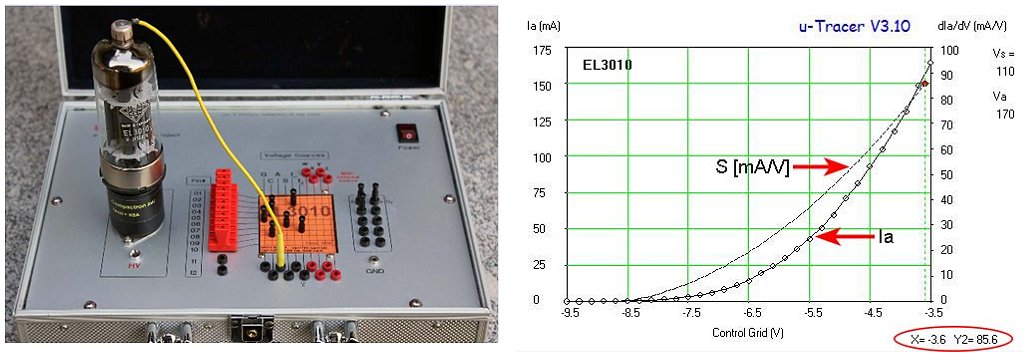
The EL3010 tested on Kurt Schmid’s uTracer.
The EL3010 made by Telefunken is claimed to be the most advanced tube ever made. Designed to be used with transistor drivers it was originally designed as a radio transmitting tube. The EL3010 has an extremely high transconductance of 90 mA/V. Tubes with high transconductances are often difficult to test because they are prone to oscillations. This especially holds for curve tracers. Reason enough for Kurt Schmid to test an EL3010 with his uTracer. The figure shows an Ia(Vgk) trace at the optimal bias point specified in the datasheet: Va = 170 V, Vs = 110V. The measurement is indeed free of oscillations, and the first derivative of the anode current to the grid voltage indicates a tranconductance of 85.6 mA/V at an anode current of 160 mA. Interesting an EL3010 today costs about the same as a complete uTracer kit! Read Kurt’s account of the measurement on the radio museum forum (in German).
Balanced valves? Might be – might not! By: Robin Simmons
Example of valves appearing to be fairly closely matched when comparing
characteristics at the manufacturers’ nominal bias/current operating point compared with what happens when measuring at the amplifiers design operating point.
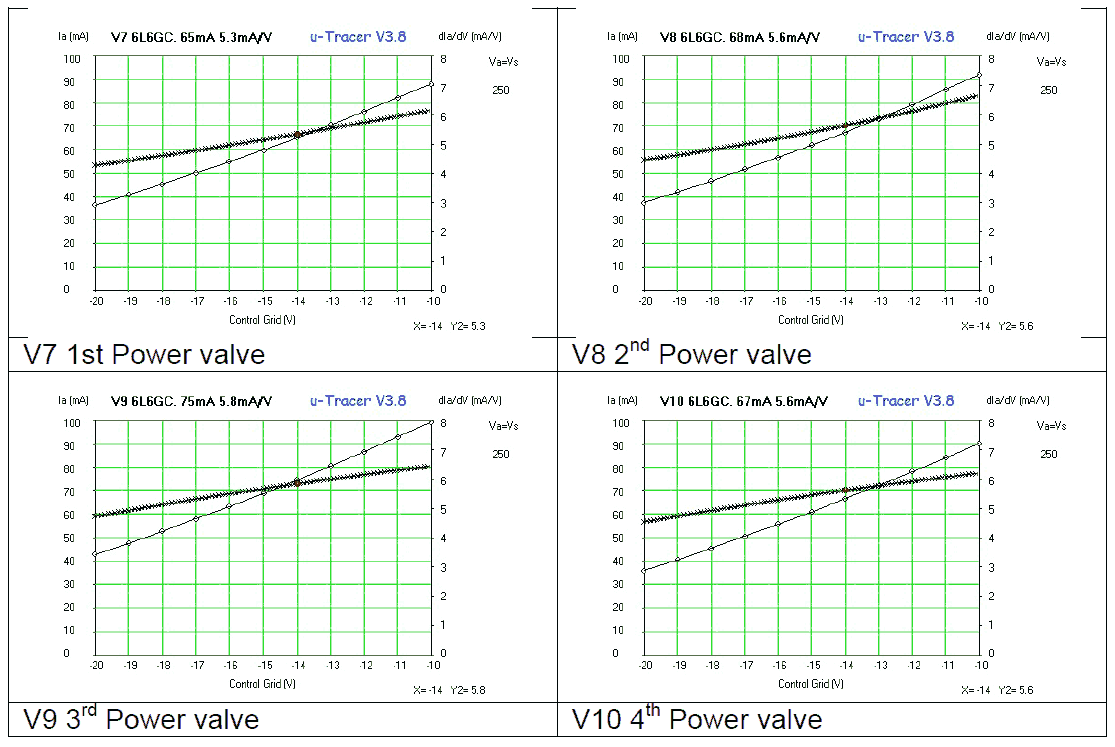
Traces below were obtained when measuring the characteristic of 4 valves in an old ‘Fender Twin Reverb’ guitar amp using 6L6GC valves stamped as ‘International C Servicemaster‘ (USSR). First impression is that the valves have a similar characteristic and should be OK for further use in a push-pull amp configuration.
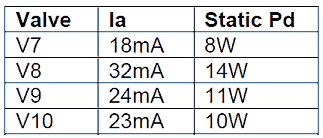
After carrying out some repairs, the amp was turned on and after warming up, the anode current was checked for each valve at the amps normal bias operating point of approximately -52V. Anode voltage is 440V. The following results were obtained.
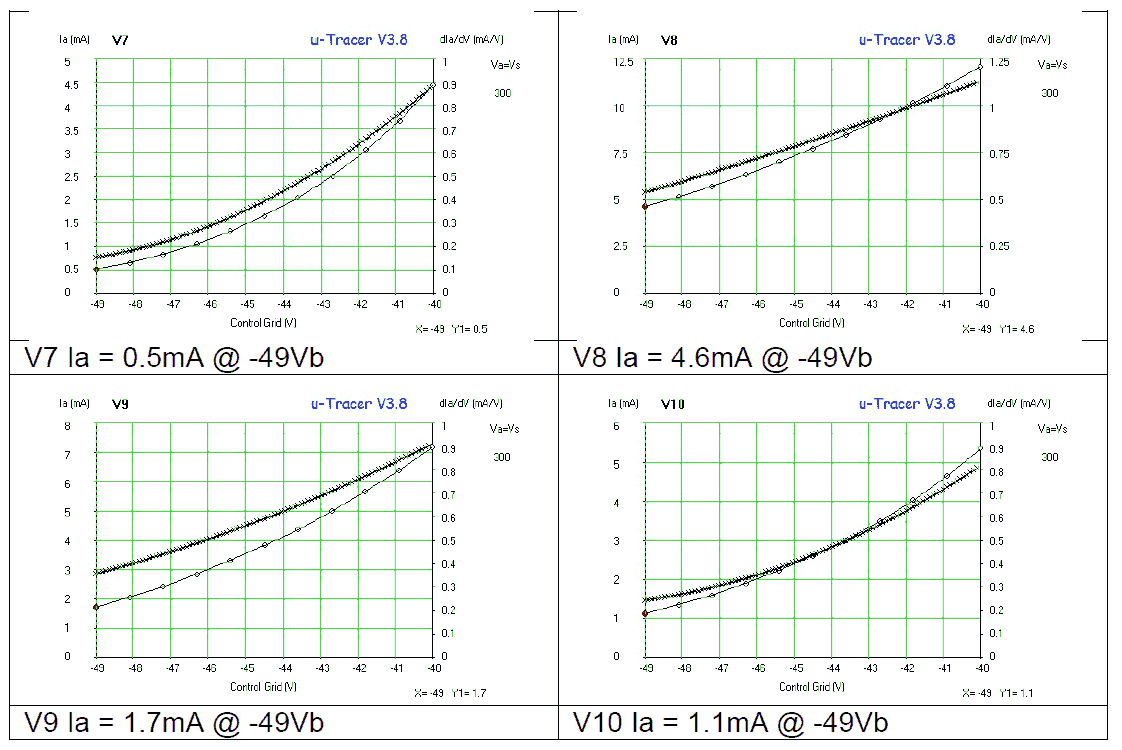
Obviously the anode currents are significantly different than might be anticipated from the previous test results. The valves were then re-tested under the nearest conditions to the amps operating point as could be obtained with the uTracer. The results are shown below. This shows how misleading it can be to test valves against data sheet performance compared with how they may actually be used in real world applications. It is also ‘ammunition’ in the argument for uTracer to have a wider range of grid bias capability plus higher anode voltages as has already been discussed on the blog. This would enable testing of valves such as EL34’s and 6L6’s under conditions much closer to how they are actually used in audio amps and hence reveal problems that may not
otherwise be so obvious.
previous page
next page