
On this page two SPICE parameter extraction tools:
ExtractModel 4 by Derk Reefman, including advanced modeling of (beam) pentodes, and
the web-based Tube-Models by Rogelio Baucells!
ExtractModel 4
His improved models include secondary emission, grid current, modeling of beam pentodes, and improved screen and anode current modeling.
Next to that he wrote an intelligent parameter extraction program “ExtractModel” that can be used to extract the model parameters from measured data.
The program uses elaborate algorithms to find the best initial parameter values to obtain the best and also physical model fits.
The program directly interfaces with the data files generated by the uTracer.
If you have questions about ExtractModel 4, please contact Derk directly: derkreefman@gmail.com
Many power tubes show substantial secondary emission effects. Those effects never received a lot of attention, because in the tube datasheets these effects where always largely ignored. After all, secondary emission was not considered something to be proud of. Still, for many designs in audio amplification, secondary emission effects can have a sizeable impact, especially for high outputs where the Ia-Va trajectory of the power tubes transverses the area where secondary emission is dominant.
Also, mixing and modulation tubes have a rich history, and spice models for these tubes are hard to find- if they exist at all. Developing a model to describe those tubes- like the ECH81 and the EF80 with g3 as modulation grid- is not possible based on the available data sheets, as those provide very little detail and only refer to what from a practical perspective was needed to design a circuit.
This and the sheer unlimited availability of tube data with the advent of the uTracer was the reason to start with the development of accurate simulation models, as much as possible based on physics of the valve, for pentodes, beam tetrodes, and hexodes/heptodes. For the pentodes, modelling secondary emission in those has received a great deal of attention. All this has resulted in a program ExtractModel that takes the output file of the uTracer, and provides a Spice simulation model as output.
ExtractModel 4 features:
- Modelling of secondary emission
- Improved screen current modelling
- Variable mu (remote cut-off) tube modelling
- Better modeling of beam pentodes
- Physical based models backed by extensive theory
- Diodes, triodes and pentodes (with and without secondary emission)
- Modeling of heptodes!
- Directly interfaces with uTracer output files
- Fully automated parameter extraction
- Elaborate algorithms for initial parameter estimation
- Directly generates a SPICE model
- Graphical output using the Gnuplot platform
- Single executable which can be evoked from the command line
- Growing LTspice library with models fitted with ExtractModel
- User manual with extensive examples of the use of ExtractModel
For users that already have been acquainted with Release 3 of ExtractModel, below are the main differences when updating to Release 4:
- Compatibility with uTracer6: Due to the capability of uTracer6 to measure grid current, the .utd file format includes a separate column for this current, even if no positive grid voltages have been included.
- The code has been refactored to explicitly calculate the total space current. Whilst this was necessary to further implement the positive grid voltage model it also comes with the fact that other tube models such as pentodes and heptodes, no longer require separate runs (using tube model X or Y).
- A new model ('DerkG') has been added to model grid current for triodes and, in a somewhat approximative way, also pentodes; grid current modelling will not become available for beam tetrodes or other models).
- In the derivation of the DerkE models a mistake was made; for the P (pentode) and B (beam tetrode) models this has been corrected. The new SPICE models are denoted by a suffix V4 to distinguish these from the earlier models of ExtractModel 3 and before. As a result, there is an improvement in modeling the knee in Vs=cst curves.
- As the minimization function for more complex models (notably the variable mu pentodes, and to a lesser extent also the heptode models, often ran into a false / suboptimal minimum, a configuration file has been created. In this file certain parameter limits are provided that help keep the minimization away from these false minima. Some other parameters are included as well.
- The format of the .ini file has been changed; no longer is the file a fixed-format file. To make transitioning to ExtractModel 4 easier, a program Old2NewIni is provided that converts old formatted .ini files into the new format.
- ExtractModel 3 was compiled using a 32-bit Microsoft compiler; ExtractModel 4 is using a 64-bit GNU Fortran compiler. As a result, the code executes faster.
- Several more general bug fixes have been included.

The download contains the latest version “ExtractModel V4” complete with theory, manual,examples, and an LTspice library (May-2026).
”Tube-Models” A web-based SPICE parameter extraction tool!
Tube-Models is web-based, takes the .utd data files generated by the uTracer, and then fits a variety of models, to the data to generate an (LT)spice model.
Being a “hardware man” myself, I am simply amazed by the ingenuity and “web-machinery” behind a beautiful tool like this! I hope you all enjoy using it!
Please find below an introduction to Tube-Models in Rogelio’s own words.
If you have questions about Tube-Models, please contact Rogelio directly at rogelio.javier@baucells.net
For uTracer Readers
Tube-Models is a web-based companion to uTracer: upload the `.utd` file, see clean curve plots, overlay classic tube models, and get SPICE-ready parameters—no installs required.
How It Compares
Similar to Derk Reefman’s ExtractModel, but fully browser-based and easier to use.
All math algorithms for parameter extraction are included, so you can fit triode, tetrode and pentode models directly from your uTracer data.
What You Get
Model fitting: Aligns theoretical curves to your measurements and extracts parameters like `mu`, `kp`, `kg1`, `kvb` for simulators.
SPICE testing: Provides ready-made SPICE circuit files to simulate your fitted model and compare against the original uTracer curves.
Curves and overlays: Visualize grid-voltage families vs plate voltage with model overlays to spot matches and deviations.
Sharing & Repository
Open by design: The code, uploaded measurements, and generated SPICE models are public.
Central library: The site supports sharing and browsing tubes and their models, acting as a community repository for uTracer measurements and SPICE parameter sets.
Why it’s Useful
Turn measurements into decisions: Export SPICE parameters and test circuits straight from your uTracer files.
Fast, friendly, shareable: Web UI; ideal for hobbyists and builders who value convenience and community.
Go directly to the Tube-Model tool: https://audio-projects.us/tube-models/
Rogelio made a short movie, demonstrating the use of “Tube-Models.”
Click here if the movie above does not play correctly.
A short manual to using “Tube-Models”
| 1 |
Open the following URL in the browser (chrome or Edge recommended/tested) https://audio-projects.us/tube-models/ |
| 2 | Select an existing tube (e.g.: ECC85). |
| 3 | You will see on the right side the models that have been calculated for this tube, in case of a triode, only the Norman Koren Triode Model is available. |
| 4 |
To validate the model against the measured data from the uTracer, select one of the imported files in the center section.
|
| 5 |
Click on the "Plot file data icon"  The uTracer file will be displayed |
| 6 |
Select in the dropdown the calculated model (Norman Koren Triode Model). The model will be plotted (evaluating the equations) and presented on top of the measurements.
|
| 7 | Adding a new tube is similar to the procedure described above with the exception that the user needs to upload the uTracer files (.utd) and press on the button to calculate the model. |


The entire Tube-Models project is open source, and the repository is available here:
https://github.com/audio-projects/tube-models
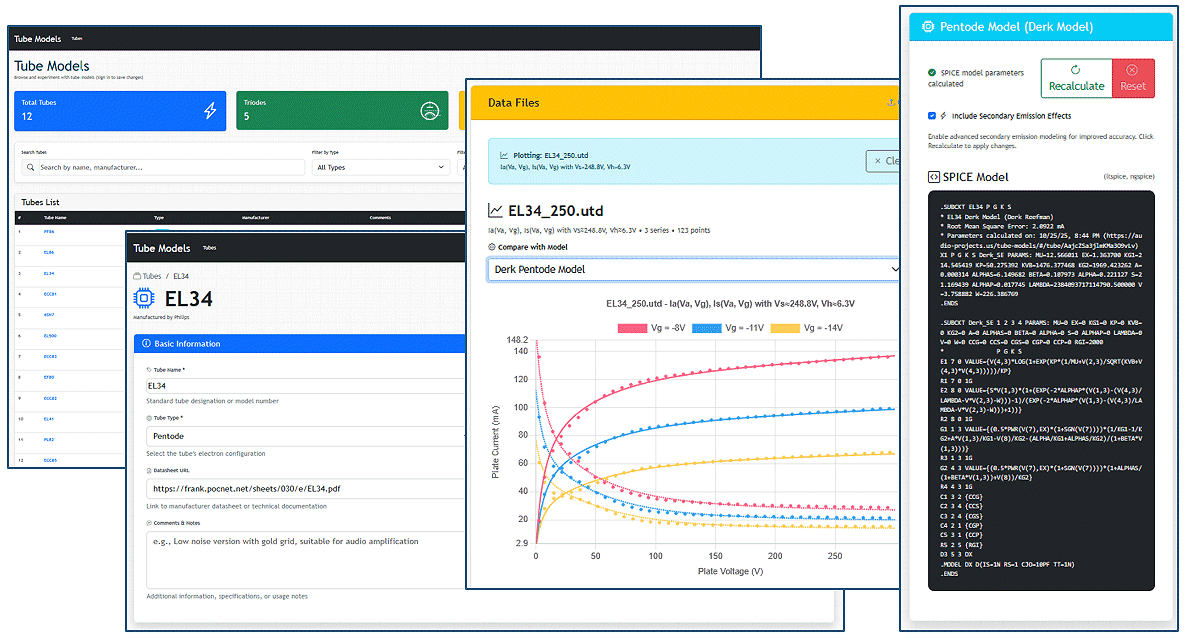
Impressions from the Tube-Models parameter extraction tool.